Internal/External Market Structure [UAlgo]The "Internal/External Market Structure " indicator is a tool designed to identify and visualize internal and external market structure based on swing highs and lows. It helps traders understand short-term (internal) and long-term (external) price behavior.
🔶 What are ChoCH and BoS?
Change of Character (ChoCH)
Change of character refers to the reversal of market trend either from bullish to bearish or bearish to bullish. ChoCH is also a break of market structure but in opposite direction.
If market is in bullish trend but it breaks it previous (higher) low and makes a lower low, it will be termed a “bearish change of character” as price changed its trend from bullish to bearish.
Like wise if price is in bearish trend and it breaks its previous (lower) high making a higher high it will be marked as “bullish change of character” as price changed its trend from bearish to bullish.
Break of Structure (BoS)
When price breaks its structure in direction of previous trend its called break of structure (BoS). So its a trend continuation pattern.
As you know in bullish trend price makes higher highs. Each time when price break a previous high and marks a new high its known as bullish break of structure.
But in bearish trend price makes lower lows so every time when price breaks previous low and makes a new low it is called as bearish break of structure.
🔶 Key Features
Internal Swing Length: Allowing for fine-tuning of sensitivity to smaller, more frequent market movements.
External Swing Length: Focusing on capturing broader market trends.
The indicator differentiates between internal and external market structures, using different styles and colors to represent each. Internal structures are shown with solid lines, while external structures use dashed lines, providing clear visual cues.
Internal Market Structure:
The internal market structure focuses on shorter-term swings and is useful for identifying minor trend changes and short-term price movements. Breaks of internal swing highs or lows can indicate potential changes in the market's direction or momentum. The labels "CHoCH" and "BoS" help distinguish between changes in character and break of structure events, respectively.
External Market Structure:
The external market structure captures larger, more significant market moves. It is particularly useful for identifying major trend changes and key support and resistance levels. The dashed lines and corresponding labels "CHoCH+" and "BoS+" indicate more substantial shifts in market sentiment.
For BoS (Break of Structure):
For ChoCH (Change of Character):
🔶 Disclaimer
Use with Caution: This indicator is provided for educational and informational purposes only and should not be considered as financial advice. Users should exercise caution and perform their own analysis before making trading decisions based on the indicator's signals.
Not Financial Advice: The information provided by this indicator does not constitute financial advice, and the creator (UAlgo) shall not be held responsible for any trading losses incurred as a result of using this indicator.
Backtesting Recommended: Traders are encouraged to backtest the indicator thoroughly on historical data before using it in live trading to assess its performance and suitability for their trading strategies.
Risk Management: Trading involves inherent risks, and users should implement proper risk management strategies, including but not limited to stop-loss orders and position sizing, to mitigate potential losses.
No Guarantees: The accuracy and reliability of the indicator's signals cannot be guaranteed, as they are based on historical price data and past performance may not be indicative of future results.
Komut dosyalarını "stop loss" için ara

RSI K-Means Clustering [UAlgo]The "RSI K-Means Clustering " indicator is a technical analysis tool that combines the Relative Strength Index (RSI) with K-means clustering techniques. This approach aims to provide more nuanced insights into market conditions by categorizing RSI values into overbought, neutral, and oversold clusters.
The indicator adjusts these clusters dynamically based on historical RSI data, allowing for more adaptive and responsive thresholds compared to traditional fixed levels. By leveraging K-means clustering, the indicator identifies patterns in RSI behavior, which can help traders make more informed decisions regarding market trends and potential reversals.
🔶 Key Features
K-means Clustering: The indicator employs K-means clustering, an unsupervised machine learning technique, to dynamically determine overbought, neutral, and oversold levels based on historical RSI data.
User-Defined Inputs: You can customize various aspects of the indicator's behavior, including:
RSI Source: Select the data source used for RSI calculation (e.g., closing price).
RSI Length: Define the period length for RSI calculation.
Training Data Size: Specify the number of historical RSI values used for K-means clustering.
Number of K-means Iterations: Set the number of iterations performed by the K-means algorithm to refine cluster centers.
Overbought/Neutral/Oversold Levels: You can define initial values for these levels, which will be further optimized through K-means clustering.
Alerts: The indicator can generate alerts for various events, including:
Trend Crossovers: Alerts for when the RSI crosses above/below the neutral zone, signaling potential trend changes.
Overbought/Oversold: Alerts when the RSI reaches the dynamically determined overbought or oversold thresholds.
Reversals: Alerts for potential trend reversals based on RSI crossing above/below the calculated overbought/oversold levels.
RSI Classification: Alerts based on the current RSI classification (ranging, uptrend, downtrend).
🔶 Interpreting Indicator
Adjusted RSI Value: The primary plot represents the adjusted RSI value, calculated based on the relative position of the current RSI compared to dynamically adjusted overbought and oversold levels. This value provides an intuitive measure of the market's momentum. The final overbought, neutral, and oversold levels are determined by K-means clustering and are displayed as horizontal lines. These levels serve as dynamic support and resistance points, indicating potential reversal zones.
Classification Symbols : The "RSI K-Means Clustering " indicator uses specific symbols to classify the current market condition based on the position of the RSI value relative to dynamically determined clusters. These symbols provide a quick visual reference to help traders understand the prevailing market sentiment. Here's a detailed explanation of each classification symbol:
Ranging Classification ("R")
This symbol appears when the RSI value is closest to the neutral threshold compared to the overbought or oversold thresholds. It indicates a ranging market, where the price is moving sideways without a clear trend direction. In this state, neither buyers nor sellers are in control, suggesting a period of consolidation or indecision. This is often seen as a time to wait for a breakout or reversal signal before taking a position.
Up-Trend Classification ("↑")
The up-trend symbol, represented by an upward arrow, is displayed when the RSI value is closer to the overbought threshold than to the neutral or oversold thresholds. This classification suggests that the market is in a bullish phase, with buying pressure outweighing selling pressure. Traders may consider this as a signal to enter or hold long positions, as the price is likely to continue rising until the market reaches an overbought condition.
Down-Trend Classification ("↓")
The down-trend symbol, depicted by a downward arrow, appears when the RSI value is nearest to the oversold threshold. This indicates a bearish market condition, where selling pressure dominates. The market is likely experiencing a downward movement, and traders might view this as an opportunity to enter or hold short positions. This symbol serves as a warning of potential further declines, especially if the RSI continues to move toward the oversold level.
Bullish Reversal ("▲")
This signal occurs when the RSI value crosses above the oversold threshold. It indicates a potential shift from a downtrend to an uptrend, suggesting that the market may start to move higher. Traders might use this signal as an opportunity to enter long positions.
Bearish Reversal ("▼")
This signal appears when the RSI value crosses below the overbought threshold. It suggests a possible transition from an uptrend to a downtrend, indicating that the market may begin to decline. This signal can alert traders to consider entering short positions or taking profits on long positions.
These classification symbols are plotted near the adjusted RSI line, with their positions adjusted based on the standard deviation and a distance multiplier. This placement helps in visualizing the classification's strength and ensuring clarity in the indicator's presentation. By monitoring these symbols, traders can quickly assess the market's state and make more informed trading decisions.
🔶 Disclaimer
Use with Caution: This indicator is provided for educational and informational purposes only and should not be considered as financial advice. Users should exercise caution and perform their own analysis before making trading decisions based on the indicator's signals.
Not Financial Advice: The information provided by this indicator does not constitute financial advice, and the creator (UAlgo) shall not be held responsible for any trading losses incurred as a result of using this indicator.
Backtesting Recommended: Traders are encouraged to backtest the indicator thoroughly on historical data before using it in live trading to assess its performance and suitability for their trading strategies.
Risk Management: Trading involves inherent risks, and users should implement proper risk management strategies, including but not limited to stop-loss orders and position sizing, to mitigate potential losses.
No Guarantees: The accuracy and reliability of the indicator's signals cannot be guaranteed, as they are based on historical price data and past performance may not be indicative of future results.

Volumetric Volatility Blocks [UAlgo]The Volumetric Volatility Blocks indicator is designed to identify significant volatility blocks based on price and volume data. It utilizes a combination of the Average True Range (ATR) and Simple Moving Average (SMA) to determine the volatility level and identify periods of heightened market activity. The indicator highlights these volatility blocks, providing traders with visual cues for potential trading opportunities. It differentiates between bullish and bearish volatility by analyzing price movement and volume, offering a nuanced view of market sentiment. This tool is particularly useful for traders looking to capitalize on periods of high volatility and momentum shifts.
🔶 Key Features
Volatility Measurement Length: Controls the period used to calculate the ATR.
Smooth Length of Volatility: Defines the period for the SMA used to smooth the ATR.
Multiplier of SMA: Sets the minimum threshold for the ATR to be considered a "high volatility" block.
Show Last X Volatility Blocks: Determines how many of the most recent volatility blocks are displayed on the chart.
Mitigation Method: Choose between "Close" or "Wick" price to filter volatility blocks based on price action. This helps avoid highlighting blocks broken by the chosen price level.
Volume Info: Displaying the volume associated with each block.
Up/Down Block Color: Sets the color for bullish and bearish volatility blocks.
🔶 Usage
The Volumetric Volatility Blocks indicator visually represents periods of high volatility with blocks on the chart. Green blocks indicate bullish volatility, while red blocks indicate bearish volatility.
Bullish Volatility Blocks: When the ATR surpasses the smoothed ATR multiplied by the set multiplier, and the price closes higher than it opened, a bullish block is formed. These blocks are generally used to identify potential buying opportunities as they indicate upward momentum.
Bearish Volatility Blocks: Conversely, bearish blocks form under the same conditions, but when the price closes lower than it opened. These blocks can signal potential selling opportunities as they highlight downward momentum.
Volume Information: Each block can display volume data, providing insight into the strength of the market movement. The percentage shown on the block indicates the relative volume contribution of that block, helping traders assess the significance of the volatility.
The volume percentages in the Volumetric Volatility Blocks indicator are calculated based on the total volume of the most recent volatility blocks. For each of the most recent volatility blocks, the percentage of the total volume is calculated by dividing the block's volume by the total volume:
🔶 Disclaimer
Use with Caution: This indicator is provided for educational and informational purposes only and should not be considered as financial advice. Users should exercise caution and perform their own analysis before making trading decisions based on the indicator's signals.
Not Financial Advice: The information provided by this indicator does not constitute financial advice, and the creator (UAlgo) shall not be held responsible for any trading losses incurred as a result of using this indicator.
Backtesting Recommended: Traders are encouraged to backtest the indicator thoroughly on historical data before using it in live trading to assess its performance and suitability for their trading strategies.
Risk Management: Trading involves inherent risks, and users should implement proper risk management strategies, including but not limited to stop-loss orders and position sizing, to mitigate potential losses.
No Guarantees: The accuracy and reliability of the indicator's signals cannot be guaranteed, as they are based on historical price data and past performance may not be indicative of future results.

Money Flow Index Trend Zone Strength [UAlgo]The "Money Flow Index Trend Zone Strength " indicator is designed to analyze and visualize the strength of market trends and OB/OS zones using the Money Flow Index (MFI). The MFI is a momentum indicator that incorporates both price and volume data, providing insights into the buying and selling pressure in the market. This script enhances the traditional MFI by introducing trend and zone strength analysis, helping traders identify potential trend reversals and continuation points.
🔶 Customizable Settings
Amplitude: Defines the range for the MFI Zone Strength calculation.
Wavelength: Period used for the MFI calculation and Stochastic calculations.
Smoothing Factor: Smoothing period for the Stochastic calculations.
Show Zone Strength: Enables/disables visualization of the MFI Zone Strength line.
Show Trend Strength: Enables/disables visualization of the MFI Trend Strength area.
Trend Strength Signal Length: Period used for the final smoothing of the Trend Strength indicator.
Trend Anchor: Selects the anchor point (0 or 50) for the Trend Strength Stochastic calculation.
Trend Transform MA Length: Moving Average length for the Trend Transform calculation.
🔶 Calculations
Zone Strength (Stochastic MFI):
The highest and lowest MFI values over a specified amplitude are used to normalize the MFI value:
MFI Highest: Highest MFI value over the amplitude period.
MFI Lowest: Lowest MFI value over the amplitude period.
MFI Zone Strength: (MFI Value - MFI Lowest) / (MFI Highest - MFI Lowest)
By normalizing and smoothing the MFI values, we aim to highlight the relative strength of different market zones.
Trend Strength:
The smoothed MFI zone strength values are further processed to calculate the trend strength:
EMA of MFI Zone Strength: Exponential Moving Average of the MFI Zone Strength over the wavelength period.
Stochastic of EMA: Stochastic calculation of the EMA values, smoothed with the same smoothing factor.
Purpose: The trend strength calculation provides insights into the underlying market trends. By using EMA and stochastic functions, we can filter out noise and better understand the overall market direction. This helps traders stay aligned with the prevailing trend and make more informed trading decisions.
🔶 Usage
Interpreting Zone Strength: The zone strength plot helps identify overbought and oversold conditions. A higher zone strength indicates potential overbought conditions, while a lower zone strength suggests oversold conditions, can suggest areas for entry/exit decisions.
Interpreting Trend Strength: The trend strength plot visualizes the underlying market trend, can help signal potential trend continuation or reversal based on the chosen anchor point.
Using the Trend Transform: The trend transform plot provides an additional layer of trend analysis, helping traders identify potential trend reversals and continuation points.
Combine the insights from the zone strength and trend strength plots with other technical analysis tools to make informed trading decisions. Look for confluence between different indicators to increase the reliability of your trades.
🔶 Disclaimer:
Use with Caution: This indicator is provided for educational and informational purposes only and should not be considered as financial advice. Users should exercise caution and perform their own analysis before making trading decisions based on the indicator's signals.
Not Financial Advice: The information provided by this indicator does not constitute financial advice, and the creator (UAlgo) shall not be held responsible for any trading losses incurred as a result of using this indicator.
Backtesting Recommended: Traders are encouraged to backtest the indicator thoroughly on historical data before using it in live trading to assess its performance and suitability for their trading strategies.
Risk Management: Trading involves inherent risks, and users should implement proper risk management strategies, including but not limited to stop-loss orders and position sizing, to mitigate potential losses.
No Guarantees: The accuracy and reliability of the indicator's signals cannot be guaranteed, as they are based on historical price data and past performance may not be indicative of future results.

Momentum & Squeeze Oscillator [UAlgo]The Momentum & Squeeze Oscillator is a technical analysis tool designed to help traders identify shifts in market momentum and potential squeeze conditions. This oscillator combines multiple timeframes and periods to provide a detailed view of market dynamics. It enhances the decision-making process for both short-term and long-term traders by visualizing momentum with customizable colors and alerts.
🔶 Key Features
Custom Timeframe Selection: Allows users to select a custom timeframe for oscillator calculations, providing flexibility in analyzing different market periods.
Recalculation Option: Enables or disables the recalculation of the indicator, offering more control over real-time data processing.
Squeeze Background Visualization: Highlights potential squeeze conditions with a background color, helping traders quickly spot consolidation periods.
Adjustable Squeeze Sensitivity: Users can modify the sensitivity of the squeeze detection, tailoring the indicator to their specific trading style and market conditions.
Bar Coloring Condition: Option to color the price bars based on momentum conditions, enhancing the visual representation of market trends.
Threshold Bands: Option to fill threshold bands for a clearer visualization of overbought and oversold levels.
Reference Lines: Display reference lines for overbought, oversold, and mid-levels, aiding in quick assessment of momentum extremes.
Multiple Output Modes: Offers different output visualization modes, including:
ALL: Displays all calculated momentum values (fast, medium, slow).
AVG: Shows the average momentum, providing a consolidated view.
STD: Displays the standard deviation of momentum, useful for understanding volatility.
Alerts: Configurable alerts for key momentum events such as crossovers and squeeze conditions, keeping traders informed of important market changes.
🔶 Usage
The Momentum & Squeeze Oscillator can be used for various trading purposes:
Trend Identification: Use the oscillator to determine the direction and strength of market trends. By analyzing the average, fast, medium, and slow momentum lines, traders can gain insights into short-term and long-term market movements.
Squeeze Detection: The indicator highlights periods of low volatility (squeeze conditions) which often precede significant price movements. Traders can use this information to anticipate and prepare for potential breakouts.
Overbought/Oversold Conditions: The oscillator helps identify overbought and oversold conditions, indicating potential reversal points. This is particularly useful for timing entry and exit points in the market.
Momentum Shifts: By monitoring the crossover of momentum lines with key levels (e.g., the 50 level), traders can spot shifts in market momentum, allowing them to adjust their positions accordingly.
🔶 Disclaimer:
Use with Caution: This indicator is provided for educational and informational purposes only and should not be considered as financial advice. Users should exercise caution and perform their own analysis before making trading decisions based on the indicator's signals.
Not Financial Advice: The information provided by this indicator does not constitute financial advice, and the creator (UAlgo) shall not be held responsible for any trading losses incurred as a result of using this indicator.
Backtesting Recommended: Traders are encouraged to backtest the indicator thoroughly on historical data before using it in live trading to assess its performance and suitability for their trading strategies.
Risk Management: Trading involves inherent risks, and users should implement proper risk management strategies, including but not limited to stop-loss orders and position sizing, to mitigate potential losses.
No Guarantees: The accuracy and reliability of the indicator's signals cannot be guaranteed, as they are based on historical price data and past performance may not be indicative of future results.

Fair Value Gap (FVG) Oscillator [UAlgo]The "Fair Value Gap (FVG) Oscillator " is designed to identify and visualize Fair Value Gaps (FVG) within a given lookback period on a trading chart. This indicator helps traders by highlighting areas where price gaps may signify potential trading opportunities, specifically bullish and bearish patterns. By leveraging volume and Average True Range (ATR) data, the FVG Oscillator aims to enhance the accuracy of pattern recognition and provide more reliable signals for trading decisions.
🔶 Identification of Fair Value Gap (FVG)
Fair Value Gaps (FVG) are specific price areas where gaps occur, and they are often considered significant in technical analysis. These gaps can indicate potential future price movements as the market may return to fill these gaps. This indicator identifies two types of FVGs:
Bullish FVG: Occurs when the current low price is higher than the high price two periods ago. This condition suggests a potential upward price movement.
Obtains with:
low > high
Bearish FVG: Occurs when the current high price is lower than the low price two periods ago. This condition suggests a potential downward price movement.
Obtains with:
high < low
The FVG Oscillator not only identifies these gaps but also verifies them using volume and ATR conditions to ensure more reliable trading signals.
🔶 Key Features
Lookback Period: Users can set the lookback period to determine how far back the indicator should search for FVG patterns.
ATR Multiplier: The ATR Multiplier is used to adjust the sensitivity of the ATR-based conditions for verifying FVG patterns.
Volume SMA Period: This setting determines the period for the Simple Moving Average (SMA) of the volume, which helps in identifying high volume conditions.
Why ATR and Volume are Used?
ATR (Average True Range) and volume are integrated into the Fair Value Gap (FVG) Oscillator to enhance the accuracy and reliability of the identified patterns. ATR measures market volatility, helping to filter out insignificant price gaps and focus on impactful ones, ensuring that the signals are relevant and strong. Volume, on the other hand, confirms the strength of price movements. High volume often indicates the sustainability of these movements, reducing the likelihood of false signals. Together, ATR and volume ensure that the detected FVGs are both significant and supported by market activity, providing more trustworthy trading signals.
Normalized Values: The FVG counts are normalized to enhance the visual representation and interpretation of the patterns on the chart.
Visual Customization and Plotting: Users can customize the colors for positive (bullish) and negative (bearish) areas, and choose whether to display these areas on the chart, also plots the bullish and bearish FVG counts, a zero line, and the net value of FVG counts. Additionally, it uses histograms to display the width of verified bullish and bearish patterns.
🔶 Disclaimer:
Use with Caution: This indicator is provided for educational and informational purposes only and should not be considered as financial advice. Users should exercise caution and perform their own analysis before making trading decisions based on the indicator's signals.
Not Financial Advice: The information provided by this indicator does not constitute financial advice, and the creator (UAlgo) shall not be held responsible for any trading losses incurred as a result of using this indicator.
Backtesting Recommended: Traders are encouraged to backtest the indicator thoroughly on historical data before using it in live trading to assess its performance and suitability for their trading strategies.
Risk Management: Trading involves inherent risks, and users should implement proper risk management strategies, including but not limited to stop-loss orders and position sizing, to mitigate potential losses.
No Guarantees: The accuracy and reliability of the indicator's signals cannot be guaranteed, as they are based on historical price data and past performance may not be indicative of future results.

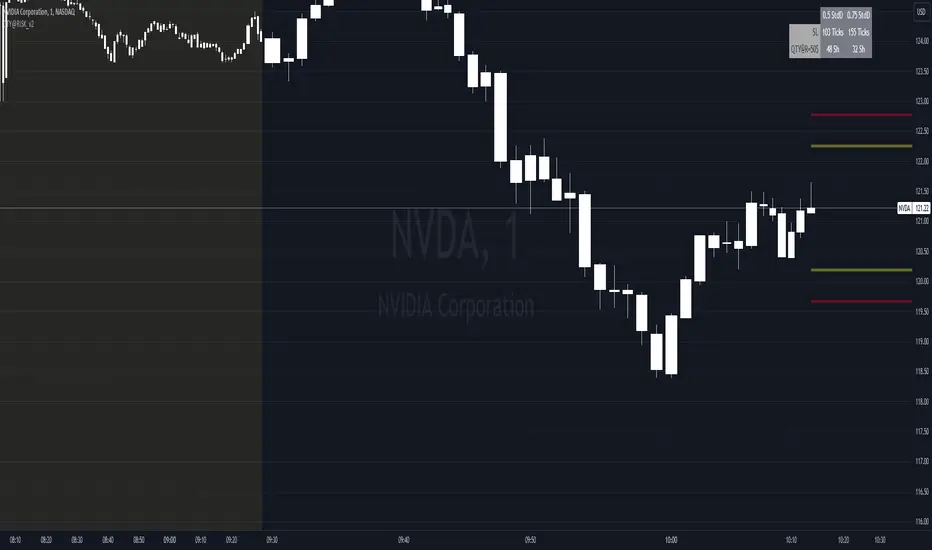
QTY@RISK VWAP based calculationVWAP Volatility-Based Risk Management Calculator for Intraday Trading
Overview
This script is an innovative tool designed to help traders manage risk effectively by calculating position sizes and stop-loss levels using the Volume Weighted Average Price (VWAP) and its standard deviation (StdDev). Unlike traditional methods that rely on time-based calculations, this approach is time-independent within the intraday timeframe, making it particularly useful for traders seeking precision and efficiency.
Key Concepts
VWAP (Volume Weighted Average Price): VWAP is a trading benchmark that represents the average price a security has traded at throughout the day, based on both volume and price. It provides insight into the average price level over a specific period, helping traders understand the market trend.
StdDev (Standard Deviation): In the context of VWAP, the standard deviation measures the volatility around the VWAP. It provides a quantifiable range that traders can use to set stop-loss levels, ensuring they are neither too tight nor too loose.
How the Script Works
1. VWAP Calculation: The script calculates the VWAP continuously as the market trades, integrating both price and volume data.
2. Volatility Measurement: It then computes the standard deviation of the VWAP, giving a measure of market volatility.
3. Stop-Loss Calculation: Using user-defined StdDev factors, the script calculates two stop-loss levels. These levels adjust dynamically based on market conditions, ensuring they remain relevant throughout the trading session.
4. Position Sizing: By incorporating your risk tolerance, the script determines the appropriate position size. This ensures that your maximum loss per trade does not exceed your predefined risk value.
How to Use the Calculator
1. Select Two VWAP StdDev Factors: Choose two standard deviation factors for calculating stop-loss levels. For example, you might choose 0.5 and 0.75 to set conservative and aggressive stop-losses respectively.
2. Set Your Trading Account Size: Enter your total trading capital. For example, $50,000.
3. Maximum Lot Size: Define the maximum number of shares you are willing to trade in a single position. For instance, 200 shares.
4. Risk Value per Trade: Input the maximum amount of money you are willing to risk on a single trade. For instance, $50.
5. Plotting Options: If you wish to visualize the stop-loss levels, enable the plot option and choose the price base for the plot, such as the closing price or the average of the high and low prices (hl2).
Example of Use
1. Initial Setup: After the market opens, wait for at least 15 minutes to ensure the VWAP has stabilized with sufficient volume data.
2. Parameter Configuration: Input your desired parameters into the calculator. For instance:
- VWAP StdDev Factors: 0.5 and 0.75
- Trading Account Size: $50,000
- Maximum Lot Size: 200 shares
- Risk Value per Trade: $50
- Plot Option: On, using "hl2" or "close" as the price base
3. Execution: Based on the inputs, the script calculates the position size and stop-loss levels. If the calculated stop-loss falls within the selected VWAP StdDev range, it will provide you with precise stop-loss prices.
4. Trading: Use the calculated position size and stop-loss levels to execute your trades confidently, knowing that your risk is managed effectively.
Advantages for Traders
- Time Independence: By relying on VWAP and its StdDev, the calculations are not dependent on specific time intervals, making them more adaptable to real-time trading conditions.
- Focus on Strategy: Novice traders can focus more on their trading strategies rather than getting bogged down with complex calculations.
- Dynamic Adjustments: The script adjusts stop-loss levels dynamically based on evolving market conditions, providing more accurate and relevant risk management.
- Flexibility: Traders can tailor the calculator to their risk preferences and trading style by adjusting the StdDev factors and risk parameters.
By incorporating these concepts and using this risk management calculator, traders can enhance their trading efficiency, improve their risk management, and ultimately make more informed trading decisions.
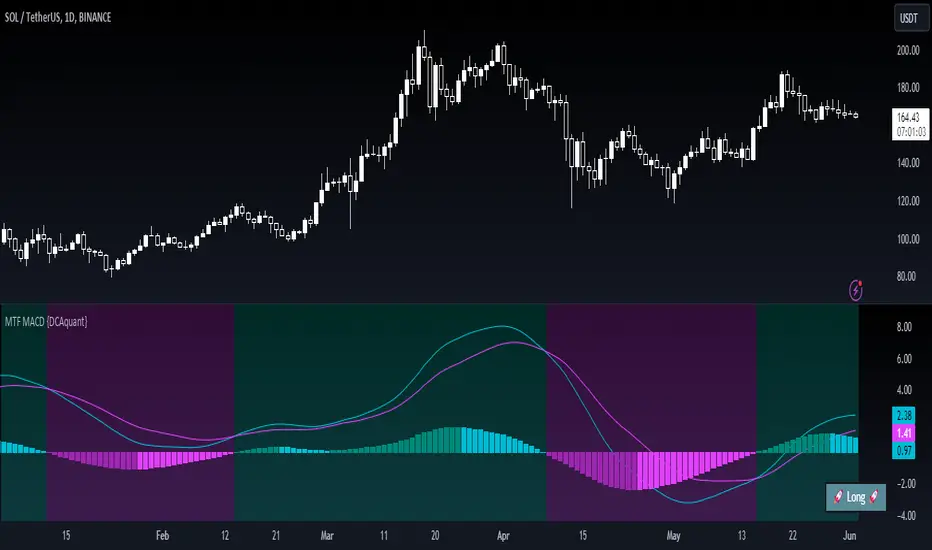
Multi Timeframe Moving Average Convergence Divergence {DCAquant}Overview
The MTF MACD indicator provides a unique view of MACD (Moving Average Convergence Divergence) and Signal Line dynamics across various timeframes. It calculates the MACD and Signal Line for each selected timeframe and aggregates them for analysis.
Key Features
MACD Calculation
Utilizes standard MACD calculations based on user-defined parameters like fast length, slow length, and signal smoothing.
Determines the difference between the MACD and Signal Line to identify convergence or divergence.
Multiple Timeframe Analysis
Allows users to select up to six different timeframes for analysis, ranging from minutes to days, providing a holistic view of market trends.
Calculates MACD and Signal Line for each timeframe independently.
Aggregated Analysis
Combines MACD and Signal Line values from multiple timeframes to derive a consolidated view.
Optionally applies moving average smoothing to aggregated MACD and Signal Line values for better clarity.
Position Identification
Determines the trading position (Long, Short, or Neutral) based on the relationship between MACD and Signal Line.
Considers the proximity of MACD and Signal Line to identify potential trading opportunities.
Visual Representation
Plots MACD and Signal Line on the price chart for visual analysis.
Utilizes color-coded backgrounds to indicate trading conditions (Long, Short, or Neutral) for quick interpretation.
Dynamic Table Display
Displays trading position alongside graphical indicators (rocket for Long, snowflake for Short, and star for Neutral) in a customizable table.
Offers flexibility in table placement and size for user preference.
How to Use
Parameter Configuration
Adjust parameters like fast length, slow length, and signal smoothing to fine-tune MACD calculations.
Select desired timeframes for analysis based on trading preferences and market conditions.
Interpretation
Monitor the relationship between MACD and Signal Line on the price chart.
Pay attention to color-coded backgrounds and graphical indicators in the table for actionable insights.
Decision Making
Consider entering Long positions when MACD is above the Signal Line and vice versa for Short positions.
Exercise caution during Neutral conditions, as there may be uncertainty in market direction.
Risk Management
Combine MTF MACD analysis with risk management strategies to optimize trade entries and exits.
Set stop-loss and take-profit levels based on individual risk tolerance and market conditions.
Conclusion
The Multi Timeframe Moving Average Convergence Divergence (MTF MACD) indicator offers a robust framework for traders to analyze market trends across multiple timeframes efficiently. By combining MACD insights from various time horizons and presenting them in a clear and actionable format, it empowers traders to make informed decisions and enhance their trading strategies.
Disclaimer
The Multi Timeframe Moving Average Convergence Divergence (MTF MACD) indicator provided here is intended for educational and informational purposes only. Trading in financial markets involves risk, and past performance is not indicative of future results. The use of this indicator does not guarantee profits or prevent losses.
Please be aware that trading decisions should be made based on your own analysis, risk tolerance, and financial situation. It is essential to conduct thorough research and seek advice from qualified financial professionals before engaging in any trading activity.
The MTF MACD indicator is a tool designed to assist traders in analyzing market trends and identifying potential trading opportunities. However, it is not a substitute for sound judgment and prudent risk management.
By using this indicator, you acknowledge that you are solely responsible for your trading decisions, and you agree to indemnify and hold harmless the developer and distributor of this indicator from any losses, damages, or liabilities arising from its use.
Trading in financial markets carries inherent risks, and you should only trade with capital that you can afford to lose. Exercise caution and discretion when implementing trading strategies, and consider seeking independent financial advice if necessary.
WaveTrendnel Oscillator [UAlgo]🔶Description:
The WaveTrendnel Oscillator, is a technical analysis tool designed for traders to identify potential trend reversals and overbought/oversold conditions in the market. It combines the concepts of wave analysis and trend analysis to generate signals based on the current market conditions. This indicator aims to provide traders with insights into the strength and direction of the prevailing trend, facilitating better decision-making in trading strategies.
🔶Key Features:
Customizable Parameters: Users can customize various parameters including the source data, channel length, average length, and signal length according to their trading preferences and market conditions.
Signal Display: The indicator offers the option to display buy and sell signals on the chart, helping traders to visually identify potential entry and exit points.
Wave and Kernel Analysis: The WaveTrendnel Oscillator utilizes a rational quadratic kernel function, which applies a mathematical approach known as the kernel method. This method analyzes historical price data by assigning weights to each data point based on its proximity to the current period, providing a smoother and more accurate representation of market trends.
Overbought/Oversold Levels: Traders can define overbought and oversold levels using customizable threshold parameters, enabling them to identify potential reversal points in the market.
🔶Credit:
The WaveTrendnel Oscillator indicator is a modification of the original WaveTrend Oscillator developed by @LazyBear on TradingView.
🔶Disclaimer:
Use with Caution: This indicator is provided for educational and informational purposes only and should not be considered as financial advice. Users should exercise caution and perform their own analysis before making trading decisions based on the indicator's signals.
Not Financial Advice: The information provided by this indicator does not constitute financial advice, and the creator (UAlgo) shall not be held responsible for any trading losses incurred as a result of using this indicator.
Backtesting Recommended: Traders are encouraged to backtest the indicator thoroughly on historical data before using it in live trading to assess its performance and suitability for their trading strategies.
Risk Management: Trading involves inherent risks, and users should implement proper risk management strategies, including but not limited to stop-loss orders and position sizing, to mitigate potential losses.
No Guarantees: The accuracy and reliability of the indicator's signals cannot be guaranteed, as they are based on historical price data and past performance may not be indicative of future results.

Liquidation Longs/Shorts [UAlgo]🔶Description:
The "Liquidation Longs/Shorts " indicator is designed to identify potential liquidation levels for long and short positions. It calculates the distance of the selected price source (close, high, low, or open) from two moving averages (MA) and plots the resulting values on the chart. When the price is at an extreme distance from the moving averages, it suggests a potential liquidation point for either long or short positions.
🔶Key Features:
Liquidation Calculations: The indicator calculates the distance of the selected price source from two moving averages: a simple moving average (SMA) and an exponential moving average (EMA) with customizable lengths.
Color Customization: Users can customize the colors of the plotted columns representing the distance from the moving averages for long and short liquidation levels.
Liquidation Circles: The indicator marks potential liquidation levels with small circles on the chart, with customizable colors for long and short liquidations.
Orange Circles -> Identifies Potential Short Liquidations
Aqua Circles -> Identifies Potential Long Liquidations
Example:
Adaptive Source Selection: Traders can select the price source (close, high, low, or open) for liquidation calculations, allowing flexibility based on their trading strategies.
Dynamic Threshold Calculation: The indicator dynamically adjusts the liquidation threshold based on the selected moving average lengths, providing adaptability to changing market conditions.
Disclaimer:
Use with Caution: This indicator is provided for educational purposes only and should not be considered as financial advice. Users should exercise caution and perform their own analysis before making trading decisions based on the indicator's signals.
Not Financial Advice: The information provided by this indicator does not constitute financial advice, and the creator (UAlgo) shall not be held responsible for any trading losses incurred as a result of using this indicator.
Backtesting Recommended: Traders are encouraged to backtest the indicator thoroughly on historical data before using it in live trading to assess its performance and suitability for their trading strategies.
Risk Management: Trading involves inherent risks, and users should implement proper risk management strategies, including but not limited to stop-loss orders and position sizing, to mitigate potential losses.
No Guarantees: The accuracy and reliability of the indicator's signals cannot be guaranteed, as they are based on historical price data and past performance may not be indicative of future results.
This indicator serves as a tool to assist traders in identifying potential liquidation levels, but it should be used in conjunction with other technical analysis tools and risk management practices for effective trading decision-making.

Portfolio HeatThe "Portfolio Heat" indicator offers a visual representation of potential risk exposure for a portfolio across up to eight different symbols. It dynamically calculates three risk metrics based on current price, the number of shares owned, your designated stop loss, and total account size.
Open Dollar Risk – the total dollar amount you will lose if your stop loss is hit.
Open % of Portfolio Risk – the risk as a percentage of your total account size.
Starting Capital Risk – the dollar amount risked based on the difference between the entry price and stop price.
These metrics adjust in real-time, allowing you to monitor and manage risk more effectively.
Open portfolio heat refers to how much you would lose if all your currently held stock positions hit their stop-losses, whether those stop-losses are below what you paid for them - referred to as your “cost basis” - at your cost basis (breakeven) or above your cost basis (in the money). Admittedly, it’s a pretty bad day when all your stops are hit at once, but as traders we need to prepare for the worst. To visualize what “open heat” looks like on a single stock position, please note the chart below:
In the example above you can see that if you were to purchase 100 shares of this stock at a cost-basis of $18/share, and your stop-loss is placed at $15, if the current price of the stock is at $20 and the stock price drops to hit your stop-loss, it would result in a $500 total drawdown in your portfolio. Keep in mind this is just one stock position. Hypothetically, if you were even holding two stocks that had the above open heat, with a $10,000 account size, you could experience a 10% drawdown quite fast if the market corrects.
The “Portfolio Heat” indicator is fully customizable allowing traders to select the number of positions in the portfolio, colors and a detailed or a summary view of risk.
Note if entering a short position, you will enter the number of shares owned as a negative number.

Risk Reward Optimiser [ChartPrime]█ CONCEPTS
In modern day strategy optimization there are few options when it comes to optimizing a risk reward ratio. Users frequently need to experiment and go through countless permutations in order to tweak, adjust and find optimal in their data.
Therefore we have created the Risk Reward Optimizer.
The Risk Reward Optimizer is a technical tool designed to provide traders with comprehensive insights into their trading strategies.
It offers a range of features and functionalities aimed at enhancing traders' decision-making process.
With a focus on comprehensive data, it is there to help traders quickly and efficiently locate Risk Reward optimums for inbuilt of custom strategies.
█ Internal and external Signals:
The script can optimize risk to reward ratio for any type of signals
You can utilize the following :
🔸Internal signals ➞ We have included a number of common indicators into the optimizer such as:
▫️ Aroon
▫️ AO (Awesome Oscillator)
▫️ RSI (Relative Strength Index)
▫️ MACD (Moving Average Convergence Divergence)
▫️ SuperTrend
▫️ Stochastic RSI
▫️ Stochastic
▫️ Moving averages
All these indicators have 3 conditions to generate signals :
Crossover
High Than
Less Than
🔸External signal
▫️ by incorporating your own indicators into the analysis. This flexibility enables you to tailor your strategy to your preferences.
◽️ How to link your signal with the optimizer:
In order to be able to analysis your signal we need to read it and to do so we would need to PLOT your signal with a defined value
plot( YOUR LONG Condition ? 100 : 0 , display = display.data_window)
█ Customizable Risk to Reward Ratios:
This tool allows you to test seven different customizable risk to reward ratios , helping you determine the most suitable risk-reward balance for your trading strategy. This data-driven approach takes the guesswork out of setting stop-loss and take-profit levels.
█ Comprehensive Data Analysis:
The tool provides a table displaying key metrics, including:
Total trades
Wins
Losses
Profit factor
Win rate
Profit and loss (PNL)
This data is essential for refining your trading strategy.
🔸 It includes a tooltip for each risk to reward ratio which gives data for the:
Most Profitable Trade USD value
Most Profitable Trade % value
Most Profitable Trade Bar Index
Most Profitable Trade Time (When it occurred)
Position and size is adjustable
█ Visual insights with histograms:
Visualize your trading performance with histograms displaying each risk to reward ratio trade space, showing total trades, wins, losses, and the ratio of profitable trades.
This visual representation helps you understand the strengths and weaknesses of your strategy.
It offers tooltips for each RR ratio with the average win and loss percentages for further analysis.
█ Dynamic Highlighting:
A drop-down menu allows you to highlight the maximum values of critical metrics such as:
Profit factor
Win rate
PNL
for quick identification of successful setups.
█ Stop Loss Flexibility:
You can adjust stop-loss levels using three different calculation methods:
ATR
Pivot
VWAP
This allows you to align risk-reward ratios with your preferred risk tolerance.
█ Chart Integration:
Visualize your trades directly on your price chart, with each trade displayed in a distinct color for easy tracking.
When your take-profit (TP) level is reached , the tool labels the corresponding risk-reward ratio for that specific TP, simplifying trade management.
█ Detailed Tooltips:
Tooltips provide deeper insights into your trading performance. They include information about the most profitable trade, such as the time it occurred, the bar index, and the percentage gain. Histogram tooltips also offer average win and loss percentages for further analysis.
█ Settings:
█ Code:
In summary, the Risk Reward Optimizer is a data-driven tool that offers traders the ability to optimize their risk-reward ratios, refine their strategies, and gain a deeper understanding of their trading performance. Whether you're a day trader, swing trader, or investor, this tool can help you make informed decisions and improve your trading outcomes.

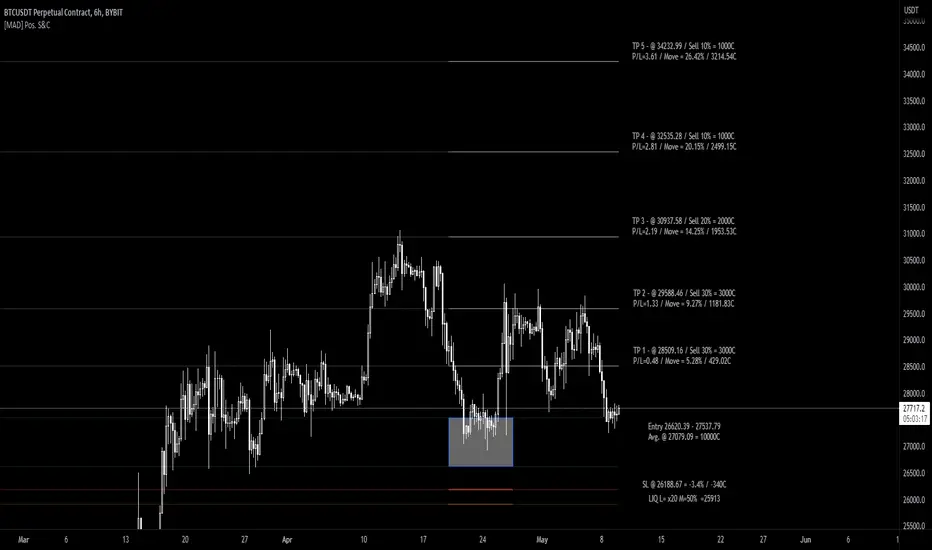
[MAD] Position starter & calculatorThe tool you're using is a financial instrument trading planner and analyzer.
Here is how to use it:
Trade Planning: You can plan your trade entries and exits, calculating potential profits, losses, and their ratio (P/L ratio).
You can define up to five target closing prices with varying volumes, which can be individually activated or deactivated (volume set to 0%).
Risk Management: There's a stop-loss function to calculate and limit potential losses.
Additionally, it includes a liquidation pre-calculation for adjustable leverages and position maintenance(subject to exchange variation).
Customization: You can customize the tool's appearance with five adjustable color schemes, light and dark.
-----------------
Initiation: This tool functions as an indicator.
To start, add it as an indicator.
Once added, you can close the indicator window.
Now wait, till you'll see a blue box at the bottom of the input window.
Parameter Input:
Enter your parameters (SL, box left, box right, TP1, TP2, TP3, TP4, TP5) in the direction of the desired trade.
Click from top to bottom for a short trade or bottom to top for a long trade.
Adjustment: If you want to move the box in the future, adjust the times in the indicator settings directly as click input is not yet platform-supported.
This tool functions as a ruler and doesn't offer alerts (for now).
Here is another examples of how to set up a Position-calculation but here for a short:
Have fun trading
Basic Position Calculator (BPC)In trading, proper position sizing is essential to managing risk and maximizing returns. The script provided is a Basic Position Calculator that allows traders to quickly and easily calculate their position size, stop loss, take profit, and risk reward ratio for a given trade.
The script starts by defining several inputs for the user to customize the calculations. The first input is the "Account Size", which specifies the total amount of funds available for the trade. The next input is "Risk Amount %", which is the percentage of the account size that the trader is willing to risk per trade. The "Stop Loss" input specifies the maximum amount of loss that the trader is willing to accept, while the "Reward" input is the desired profit target for the trade. Finally, there is a "Position" input that allows the user to specify where on the chart the table of calculations will be displayed.
The script then calculates the position size, stop loss, take profit and risk reward ratio using the user-specified inputs. The position size is calculated by dividing the risk amount by the stop loss. The stop loss is calculated by multiplying the stop loss percentage by the close price, and the take profit is calculated by multiplying the stop loss percentage by the close price and the reward. Risk-reward ratio is the ratio of amount of profit potential to the amount of risk in a trade.
The script then creates a table and displays the calculated values on the chart at the specified location. The table includes the following information: account size, position size, account risk %, stop loss, stop loss %, take profit, take profit % and risk reward ratio. This allows the trader to quickly and easily see all the key calculations for their trade in one place.
Overall, the Basic Position Calculator script is a valuable tool for any trader looking to quickly and easily calculate their position size, stop loss, take profit, and risk reward ratio for a given trade. The ability to customize the inputs and display the calculations on the chart makes it a useful and user-friendly tool for managing risk and maximizing returns.

[ChasinAlts]Top-Wicked Good S/R LinesHello Tradeurs, as per usual, I hope everyone is having a FAN-FRIGGIN-TASTIC day. With the soon incoming bull market approaching fast(Nov 7, 2022), there are a few ideas that I've really been trying to push out to help nail a few coins as they are near their bottom peak of this closing Bear Market. This one may seem very similar to the last one I posted but I think this one takes the cake...esp when you see the next script from my 'Market Overview' series that I will be publishing shortly after this one as it is utilizing this new script for a market scanner that will be SUPER legit and profitable. Though it is alway nice to be noticed, I'm glad that I'm relatively unpopular so the few people that are now following me can have some time to make some money with some of these scripts I'm trying to pump out for the benefit of the community. I will rarely give my full analysis of how I take in and utilize these scripts but I can tell you, QUITE A FEW of them are money in the bank. Esp these last few I've done/am doing and even more-so the ones that are soon to come (I'm speaking of about the next 3-4 that I will be attempting to pump out in this next VERY IMPORTANT week.). One more thing I'll add before going to the script is a little alpha(Im pretty certain this is the way it is going but NOTHING is EVERY 100% in life). What I believe should be realized is the bottoming out of MANY of the crypto coins at the VERY bottom of a LONG TERM Cup and Handle (so it seems but shat can still change in the blink of an eye). Thus there are quite a few coins that I believe have already bottomed and wont be returning to said bottom for a few years or so but there are also quite a few still at the brink of the bottomest part before the real market breakout occurs. My goal with these scripts coming out this week to help you all find those coins that have yet to hit their very bottom (thus the ATH/ATL script recently published). Going back in history looking for the lowest points of long term Cup & Handles I will point out 2 key things. Near the center/bottomest part of these historical CnH you will see either Double Bottoms OR a Huge dump and then its V-shaped recovery. After these print the point of no return has occurred where only a few coins will be going lower than these Double Bottoms/V-Shaped recoveries. So the time is at hand. Now that many coins are seemingly pumping after this long consolidation, I believe we need to keep a keen eye out for THE FINAL RUG PULL (as soon as enough degenerates are leveraging Long their entire savings.). What Im saying is be ready for this final rug pull to finally be seeing these Double Bottoms/V-Shaped recoveries VERY soon. DO NOT waste all your capital yet and MAKE SURE to use stop losses or else rather than stop losses you will be burdened with MUCH WORSE losses. Im currently not even in the market bc I am waiting on said rug pull. Ok for the Script now.
This script is similar to the last one but with the previous one, one general set of settings can produce VASTLY different results (might have 2 S/R lines on one coin and 80 on another). I wanted to fix that with this script, turn it into a "Market Overview" Scanner and create alerts for the MO Scanner to be able to get alerted any time a coin is passing its largest wick S/R levels bc DULY NOTE...it is VERY rare that a coin will blow past it if it hasn't approached it recently. That means that a small retrace of 3-5%(or more) is EASY to acquire (with leverage that can really add up with how many coins are in the Kucoin Margin Coin list that I have in my scanners). Now, once price does shoot through a level you best be sure to be looking down the line for a retest of the S/R level it blew past before as they are MANY times the retest level and price will be coming back to it before continuing
in the direction it was going. Depending on the TF your using this could be a few hours to a few days to a few weeks...you get it. With this script you can choose to draw S/R lines 2 ways: 1) by having it plot S/R lines on the end of the largest 2(3,4,5..however many you choose) wicks that the chart has access to. For the scanner ill just be putting the largest 2-3 wicks and set alerts when coming up to them/crossing them & 2) having it draw S/R lines on the ends of the largest X% of wicks. it will be erasing the lines and drawing new ones on each new candle occurrence so the same general settings will no longer be producing VASTLY diff amounts of S/R lines and will be way more consistent amongst the coins for better utilization with the scanner (when I publish it). There is also a Wick Max Cutoff % so for those coins that had it's first few hours printing 100% sized wicks...you can choose to ignore them so they are not taking up one of your top spots for the S/R lines. There is similarly a Wick % min Size that can be selected so if you’re using the top % setting, it will help decrease those coins that can be still plotting 30 lines even though the top 3% of the largest wicks are set in the settings. Hope Im being clear but it's easy enough. I believe in you and your capabilities of comprehending it all and getting it all figured out. So this script is for a visualization for the scanner that I will be uploading soon-after. It's always nice to get a few comments if my ideas/scripts have been helpful to you and please don't hold back if you have something to tell me that I screwed up on (I am still rather new to this coding thing but I like to think I at least have some fresh ideas that aren’t out there in the public library). Talk to you soon and may the force be with your trades. Peace and love people...peace and love. -ChasinAlts out.

AlphaTrendAlphaTrend is a brand new indicator which I've personally derived from Trend Magic and still developing:
In Magic Trend we had some problems, Alpha Trend tries to solve those problems such as:
1-To minimize stop losses and overcome sideways market conditions.
2-To have more accurate BUY/SELL signals during trending market conditions.
3- To have significant support and resistance levels.
4- To bring together indicators from different categories that are compatible with each other and make a meaningful combination regarding momentum, trend, volatility, volume and trailing stop loss.
according to those purposes Alpha Trend:
1- Acts like a dead indicator like its ancestor Magic Trendin sideways market conditions and doesn't give many false signals.
2- With another line with 2 bars offsetted off the original one Alpha Trend have BUY and SELL signals from their crossovers.
BUY / LONG when Alpha Trend line crosses above its 2 bars offsetted line and there would be a green filling between them
SELL / SHORT when Alpha Trend line crosses below its 2 bars offsetted line and filling would be red then.
3- Alpha Trend lines
-act as support levels when an uptrend occurs trailing 1*ATR (default coefficient) distance from bar's low values
-conversely act as resistancelevels when a downtrend occurs trailing 1*ATR (default coefficient) distance from bar's high values
and acting as trailing stop losses
the more Alpha Trend lines straighter the more supports and resistances become stronger.
4- Trend Magic has CCI in calculation
Alpha Trend has MFI as momentum, but when there's no volume data MFI has 0 values, so there's abutton to change calculation considering RSI after checking the relevant box to overcome this problem when there is no volume data in that chart.
Momentum: RSI and MFI
Trend: Magic Trend
Volatility: ATR,
Trailing STOP: ATR TRAILING STOP
Volume: MFI
Alpha trend is really a combination of different types...
default values:
coefficient: 1 which is the factor of trailing ATR value
common period: 14 which is the length of ATR MFI and RSI
Wish you all use AlphaTrend in profitable trades.
Kıvanç Özbilgiç

[Sextan] T-Step LSMA MTF BacktestLevel: 1
NOTE: This is a request by @scantor516 to backtest T-Step LSMA by alexgrover with my Sextan framework. You can backtest many of my indicators in minutes now! Of course,you can define your own indicator in the highlighted area in compliance with the uniform format, which guarantee when you use "Indicator on Indicator" function, it would not produce any error.
Courtesy of alexgrover for his T-Step LSMA
Background
Backtesting of technical indicators and strategies is the most common way to understand a quantitative strategy. However, the complicated configuration and adaptation work of backtesting many quantitative tools makes many traders who do not understand the code daunted. Moreover, although I have written a lot of strategies, I am still not very satisfied with the backtest configuration and writing efficiency. Therefore, I have been thinking about how to build a backtesting framework that can quickly and easily evaluate the backtesting performance of any indicator with a "long/short entry" indicator, that is, a "simple backtesting tool for dummies". The performance requirements should be stable, and the operation should be simple and convenient. It is best to "copy", "paste", and "a few mouse clicks" to complete the quick backtest and evaluation of a new indicator.
Luckily, I recently realized that TradingView provides an "Indicator on Indicator" feature, which is the perfect foundation for doing "hot swap" backtesting. My basic idea is to use a two-layer design. The first layer is the technical indicator signal source that needs to be embedded, which is only used to provide buy and sell signals of custom strategies; the second layer is the trading system, which is used to receive the output signals of the first layer, and filter the signals according to the agreed specifications. , Take Profit, Stop Loss, draw buy and sell signals and cost lines, define and send custom buy and sell alert messages to mobile phones, social software or trading interfaces. In general, this two-layer design is a flexible combination of "death and alive", which can meet the needs of most traders to quickly evaluate the performance of a certain technical indicator. The first layer here is flexible. Users can insert their own strategy codes according to my template, and they can draw buy and sell signals and output them to the second layer. The second layer is fixed, and the overall framework is solidified to ensure the stability and unity of the trading system. It is convenient to compare different or similar strategies under the same conditions. Finally, all trading signals are drawn on the chart, and the output strategy returns. test report.
The main function:
The first layer: "{Sextan} Your Indicator Source", the script provides a template for personalized strategy input, and the signal and definition interfaces ensure full compatibility with the second layer. Backtesting is performed stably in the backtesting framework of the layer. The first layer of this script is also relatively simple: enter your script in the highlighted custom script area, and after ensuring the final buy and sell signals long = bool condition, short = bool condition, the design of the first layer is considered complete. Input it into the PINE script editor of TradingView, save it and add it to the chart, you can see the pulse sequence in yellow (buy) and purple (sell) on the sub-picture, corresponding to the main picture, you can subjectively judge that the quality of the trading point of the strategy is good Bad.
The second layer: "{Sextan} PINEv4 Sextans Backtest Framework". This script is the standardized trading system strategy execution and alarm, used to generate the final report of the strategy backtest and some key indicators that I have customized that I find useful, such as: winning rate , Odds, Winning Surface, Kelly Ratio, Take Profit and Stop Loss Thresholds, Trading Frequency, etc. are evaluated according to the Kelly formula. To use the second layer, first load it into the TrainingView chart, no markers will appear on the chart, since you have not specified any strategy source signals, click on the gear-shaped setting next to the "{Sextan} PINEv4 Sextans BTFW" header button, you can open the backtest settings, the first item is to select your custom strategy source. Because we have added the strategy source to the chart in the previous step, you can easily find an option "{Sextan} Your Indicator Source: Signal" at the bottom of the list, this is the strategy source input we need, select and confirm , you can see various markers on the main graph, and quickly generate a backtesting profit graph and a list of backtesting reports. You can generate files and download the backtesting reports locally. You can also click the gear on the backtest chart interface to customize some conditions of the backtest, including: initial capital amount, currency type, percentage of each order placed, amount of pyramid additions, commission fees, slippage, etc. configuration. Note: The configuration in the interface dialog overrides the same configuration implemented by the code in the backtest script.
How to output charts:
The first layer: "{Sextan} Your Indicator Source", the output of this script is the pulse value of yellow and purple, yellow +1 means buy, purple -1 means sell.
The second layer: PINEv4 Sextans Backtest Framework". The output of this script is a bit complicated. After all, it is the entire trading system with a lot of information:
1. Blue and red arrows. The blue upward arrow indicates long position, the red downward arrow indicates short position, and the horizontal bar at the end of the purple arrow indicates take profit or stop loss exit.
2. Red and green lines. This is the holding cost line of the strategy, green represents the cost of holding a long position, and red represents the cost of holding a short position. The cost line is a continuous solid line and the price action is relatively close.
3. Green and yellow long take profit and stop loss area and green and yellow long take profit and stop loss fork. Once a long position is held, there is a conditional order for take profit and stop loss. The green horizontal line is the long take profit ratio line, and the yellow is the long stop loss ratio line; the green cross indicates the long take profit price, and the yellow cross indicates the long position. Stop loss price. It's worth noting that the prongs and wires don't necessarily go together. Because of the optimization of the algorithm, for a strong market, the take profit will occur after breaking the take profit line, and the profit will not be taken until the price falls.
4. The purple and red short take profit and stop loss area and the purple red short stop loss fork. Once a short position is held, there will be a take profit and stop loss conditional order, the red is the short take profit ratio line, and the purple is the short stop loss ratio line; the red cross indicates the short take profit price, and the purple cross indicates the short stop loss price.
5. In addition to the above signs, there are also text and numbers indicating the profit and loss values of long and short positions. "L" means long; "S" means short; "XL" means close long; "XS" means close short.
TradingView Strategy Tester Panel:
The overview graph is an intuitive graph that plots the blue (gain) and red (loss) curves of all backtest periods together, and notes: the absolute value and percentage of net profit, the number of all closed positions, the winning percentage, the profit factor, The maximum trading loss, the absolute value and ratio of the average trading profit and loss, and the average number of K-lines held in all trades.
Another is the performance summary. This is to display all long and short statistical indicators of backtesting in the form of a list, such as: net profit, gross profit, Sharpe ratio, maximum position, commission, times of profit and loss, etc.
Finally, the transaction list is a table indexed by the transaction serial number, showing the signal direction, date and time, price, profit and loss, accumulated profit and loss, maximum transaction profit, transaction loss and other values.
Remarks
Finally, I will explain that this is just the beginning of this model. I will continue to optimize the trading system of the second layer. Various optimization feedback and suggestions are welcome. For valuable feedback, I am willing to provide some L4/L5 technical indicators as rewards for free subscription rights.

[Sextan] %R Trend Exhaustion BacktestLevel: 1
NOTE: This is a request by @upslidedown to backtest %R Trend Exhaustion by upslidedown with my Sextan framework. You can backtest many of my indicators in minutes now! Of course,you can define your own indicator in the highlighted area in compliance with the uniform format, which guarantee when you use "Indicator on Indicator" function, it would not produce any error.
Courtesy of upslidedown for his %R Trend Exhaustionindicator
Background
Backtesting of technical indicators and strategies is the most common way to understand a quantitative strategy. However, the complicated configuration and adaptation work of backtesting many quantitative tools makes many traders who do not understand the code daunted. Moreover, although I have written a lot of strategies, I am still not very satisfied with the backtest configuration and writing efficiency. Therefore, I have been thinking about how to build a backtesting framework that can quickly and easily evaluate the backtesting performance of any indicator with a "long/short entry" indicator, that is, a "simple backtesting tool for dummies". The performance requirements should be stable, and the operation should be simple and convenient. It is best to "copy", "paste", and "a few mouse clicks" to complete the quick backtest and evaluation of a new indicator.
Luckily, I recently realized that TradingView provides an "Indicator on Indicator" feature, which is the perfect foundation for doing "hot swap" backtesting. My basic idea is to use a two-layer design. The first layer is the technical indicator signal source that needs to be embedded, which is only used to provide buy and sell signals of custom strategies; the second layer is the trading system, which is used to receive the output signals of the first layer, and filter the signals according to the agreed specifications. , Take Profit, Stop Loss, draw buy and sell signals and cost lines, define and send custom buy and sell alert messages to mobile phones, social software or trading interfaces. In general, this two-layer design is a flexible combination of "death and alive", which can meet the needs of most traders to quickly evaluate the performance of a certain technical indicator. The first layer here is flexible. Users can insert their own strategy codes according to my template, and they can draw buy and sell signals and output them to the second layer. The second layer is fixed, and the overall framework is solidified to ensure the stability and unity of the trading system. It is convenient to compare different or similar strategies under the same conditions. Finally, all trading signals are drawn on the chart, and the output strategy returns. test report.
The main function:
The first layer: "{Sextan} Your Indicator Source", the script provides a template for personalized strategy input, and the signal and definition interfaces ensure full compatibility with the second layer. Backtesting is performed stably in the backtesting framework of the layer. The first layer of this script is also relatively simple: enter your script in the highlighted custom script area, and after ensuring the final buy and sell signals long = bool condition, short = bool condition, the design of the first layer is considered complete. Input it into the PINE script editor of TradingView, save it and add it to the chart, you can see the pulse sequence in yellow (buy) and purple (sell) on the sub-picture, corresponding to the main picture, you can subjectively judge that the quality of the trading point of the strategy is good Bad.
The second layer: "{Sextan} PINEv4 Sextans Backtest Framework". This script is the standardized trading system strategy execution and alarm, used to generate the final report of the strategy backtest and some key indicators that I have customized that I find useful, such as: winning rate , Odds, Winning Surface, Kelly Ratio, Take Profit and Stop Loss Thresholds, Trading Frequency, etc. are evaluated according to the Kelly formula. To use the second layer, first load it into the TrainingView chart, no markers will appear on the chart, since you have not specified any strategy source signals, click on the gear-shaped setting next to the "{Sextan} PINEv4 Sextans BTFW" header button, you can open the backtest settings, the first item is to select your custom strategy source. Because we have added the strategy source to the chart in the previous step, you can easily find an option "{Sextan} Your Indicator Source: Signal" at the bottom of the list, this is the strategy source input we need, select and confirm , you can see various markers on the main graph, and quickly generate a backtesting profit graph and a list of backtesting reports. You can generate files and download the backtesting reports locally. You can also click the gear on the backtest chart interface to customize some conditions of the backtest, including: initial capital amount, currency type, percentage of each order placed, amount of pyramid additions, commission fees, slippage, etc. configuration. Note: The configuration in the interface dialog overrides the same configuration implemented by the code in the backtest script.
How to output charts:
The first layer: "{Sextan} Your Indicator Source", the output of this script is the pulse value of yellow and purple, yellow +1 means buy, purple -1 means sell.
The second layer: PINEv4 Sextans Backtest Framework". The output of this script is a bit complicated. After all, it is the entire trading system with a lot of information:
1. Blue and red arrows. The blue upward arrow indicates long position, the red downward arrow indicates short position, and the horizontal bar at the end of the purple arrow indicates take profit or stop loss exit.
2. Red and green lines. This is the holding cost line of the strategy, green represents the cost of holding a long position, and red represents the cost of holding a short position. The cost line is a continuous solid line and the price action is relatively close.
3. Green and yellow long take profit and stop loss area and green and yellow long take profit and stop loss fork. Once a long position is held, there is a conditional order for take profit and stop loss. The green horizontal line is the long take profit ratio line, and the yellow is the long stop loss ratio line; the green cross indicates the long take profit price, and the yellow cross indicates the long position. Stop loss price. It's worth noting that the prongs and wires don't necessarily go together. Because of the optimization of the algorithm, for a strong market, the take profit will occur after breaking the take profit line, and the profit will not be taken until the price falls.
4. The purple and red short take profit and stop loss area and the purple red short stop loss fork. Once a short position is held, there will be a take profit and stop loss conditional order, the red is the short take profit ratio line, and the purple is the short stop loss ratio line; the red cross indicates the short take profit price, and the purple cross indicates the short stop loss price.
5. In addition to the above signs, there are also text and numbers indicating the profit and loss values of long and short positions. "L" means long; "S" means short; "XL" means close long; "XS" means close short.
TradingView Strategy Tester Panel:
The overview graph is an intuitive graph that plots the blue (gain) and red (loss) curves of all backtest periods together, and notes: the absolute value and percentage of net profit, the number of all closed positions, the winning percentage, the profit factor, The maximum trading loss, the absolute value and ratio of the average trading profit and loss, and the average number of K-lines held in all trades.
Another is the performance summary. This is to display all long and short statistical indicators of backtesting in the form of a list, such as: net profit, gross profit, Sharpe ratio, maximum position, commission, times of profit and loss, etc.
Finally, the transaction list is a table indexed by the transaction serial number, showing the signal direction, date and time, price, profit and loss, accumulated profit and loss, maximum transaction profit, transaction loss and other values.
Remarks
Finally, I will explain that this is just the beginning of this model. I will continue to optimize the trading system of the second layer. Various optimization feedback and suggestions are welcome. For valuable feedback, I am willing to provide some L4/L5 technical indicators as rewards for free subscription rights.

[Sextan] Your Indicator Source PINE v5 MTFLevel: 1
NOTE1: As requested, this is a multiple time frame(MTF) version of input signal source, which enable you to backtest any indicator/strategy MTF with "{Sextan} PINEv4 Sextans Backtest Framework". Courtesy of cheatcountry for his request.security() wrapper in PINE v5 to avoid repainting caused by request.security() function.
NOTE2: Many request this indicator template to support PINE v5. Now, here it is .This is ONLY an PINE v5 EXAMPLE on HOW-TO produce a customized "{Sextan} PINEv4 Sextans Backtest Framework" (for bactest framework it does not need to be written by PINE v5)intput signal source, you can define your own indicator in the highlighted area in compliance with the uniform format, which guarantee when you use "Indicator on Indicator" function, it would not produce any error.
I use two simple moving average crossings to produce long and short entry signal with SMA3 and SMA8 in the example.
Background
Backtesting of technical indicators and strategies is the most common way to understand a quantitative strategy. However, the complicated configuration and adaptation work of backtesting many quantitative tools makes many traders who do not understand the code daunted. Moreover, although I have written a lot of strategies, I am still not very satisfied with the backtest configuration and writing efficiency. Therefore, I have been thinking about how to build a backtesting framework that can quickly and easily evaluate the backtesting performance of any indicator with a "long/short entry" indicator, that is, a "simple backtesting tool for dummies". The performance requirements should be stable, and the operation should be simple and convenient. It is best to "copy", "paste", and "a few mouse clicks" to complete the quick backtest and evaluation of a new indicator.
Luckily, I recently realized that TradingView provides an "Indicator on Indicator" feature, which is the perfect foundation for doing "hot swap" backtesting. My basic idea is to use a two-layer design. The first layer is the technical indicator signal source that needs to be embedded, which is only used to provide buy and sell signals of custom strategies; the second layer is the trading system, which is used to receive the output signals of the first layer, and filter the signals according to the agreed specifications. , Take Profit, Stop Loss, draw buy and sell signals and cost lines, define and send custom buy and sell alert messages to mobile phones, social software or trading interfaces. In general, this two-layer design is a flexible combination of "death and alive", which can meet the needs of most traders to quickly evaluate the performance of a certain technical indicator. The first layer here is flexible. Users can insert their own strategy codes according to my template, and they can draw buy and sell signals and output them to the second layer. The second layer is fixed, and the overall framework is solidified to ensure the stability and unity of the trading system. It is convenient to compare different or similar strategies under the same conditions. Finally, all trading signals are drawn on the chart, and the output strategy returns. test report.
The main function:
The first layer: "{Sextan} Your Indicator Source", the script provides a template for personalized strategy input, and the signal and definition interfaces ensure full compatibility with the second layer. Backtesting is performed stably in the backtesting framework of the layer. The first layer of this script is also relatively simple: enter your script in the highlighted custom script area, and after ensuring the final buy and sell signals long = bool condition, short = bool condition, the design of the first layer is considered complete. Input it into the PINE script editor of TradingView, save it and add it to the chart, you can see the pulse sequence in yellow (buy) and purple (sell) on the sub-picture, corresponding to the main picture, you can subjectively judge that the quality of the trading point of the strategy is good Bad.
The second layer: "{Sextan} PINEv4 Sextans Backtest Framework". This script is the standardized trading system strategy execution and alarm, used to generate the final report of the strategy backtest and some key indicators that I have customized that I find useful, such as: winning rate , Odds, Winning Surface, Kelly Ratio, Take Profit and Stop Loss Thresholds, Trading Frequency, etc. are evaluated according to the Kelly formula. To use the second layer, first load it into the TrainingView chart, no markers will appear on the chart, since you have not specified any strategy source signals, click on the gear-shaped setting next to the "{Sextan} PINEv4 Sextans BTFW" header button, you can open the backtest settings, the first item is to select your custom strategy source. Because we have added the strategy source to the chart in the previous step, you can easily find an option "{Sextan} Your Indicator Source: Signal" at the bottom of the list, this is the strategy source input we need, select and confirm , you can see various markers on the main graph, and quickly generate a backtesting profit graph and a list of backtesting reports. You can generate files and download the backtesting reports locally. You can also click the gear on the backtest chart interface to customize some conditions of the backtest, including: initial capital amount, currency type, percentage of each order placed, amount of pyramid additions, commission fees, slippage, etc. configuration. Note: The configuration in the interface dialog overrides the same configuration implemented by the code in the backtest script.
How to output charts:
The first layer: "{Sextan} Your Indicator Source", the output of this script is the pulse value of yellow and purple, yellow +1 means buy, purple -1 means sell.
The second layer: PINEv4 Sextans Backtest Framework". The output of this script is a bit complicated. After all, it is the entire trading system with a lot of information:
1. Blue and red arrows. The blue upward arrow indicates long position, the red downward arrow indicates short position, and the horizontal bar at the end of the purple arrow indicates take profit or stop loss exit.
2. Red and green lines. This is the holding cost line of the strategy, green represents the cost of holding a long position, and red represents the cost of holding a short position. The cost line is a continuous solid line and the price action is relatively close.
3. Green and yellow long take profit and stop loss area and green and yellow long take profit and stop loss fork. Once a long position is held, there is a conditional order for take profit and stop loss. The green horizontal line is the long take profit ratio line, and the yellow is the long stop loss ratio line; the green cross indicates the long take profit price, and the yellow cross indicates the long position. Stop loss price. It's worth noting that the prongs and wires don't necessarily go together. Because of the optimization of the algorithm, for a strong market, the take profit will occur after breaking the take profit line, and the profit will not be taken until the price falls.
4. The purple and red short take profit and stop loss area and the purple red short stop loss fork. Once a short position is held, there will be a take profit and stop loss conditional order, the red is the short take profit ratio line, and the purple is the short stop loss ratio line; the red cross indicates the short take profit price, and the purple cross indicates the short stop loss price.
5. In addition to the above signs, there are also text and numbers indicating the profit and loss values of long and short positions. "L" means long; "S" means short; "XL" means close long; "XS" means close short.
TradingView Strategy Tester Panel:
The overview graph is an intuitive graph that plots the blue (gain) and red (loss) curves of all backtest periods together, and notes: the absolute value and percentage of net profit, the number of all closed positions, the winning percentage, the profit factor, The maximum trading loss, the absolute value and ratio of the average trading profit and loss, and the average number of K-lines held in all trades.
Another is the performance summary. This is to display all long and short statistical indicators of backtesting in the form of a list, such as: net profit, gross profit, Sharpe ratio, maximum position, commission, times of profit and loss, etc.
Finally, the transaction list is a table indexed by the transaction serial number, showing the signal direction, date and time, price, profit and loss, accumulated profit and loss, maximum transaction profit, transaction loss and other values.
Remarks
Finally, I will explain that this is just the beginning of this model. I will continue to optimize the trading system of the second layer. Various optimization feedback and suggestions are welcome. For valuable feedback, I am willing to provide some L4/L5 technical indicators as rewards for free subscription rights.

[Sextan] Your Indicator Source PINE v4 MTFLevel: 1
NOTE1: As requested, this is a multiple time frame(MTF) version of input signal source, which enable you to backtest any indicator/strategy MTF with "{Sextan} PINEv4 Sextans Backtest Framework". Courtesy of cheatcountry for his security() wrapper to avoid repainting caused by security() function.
NOTE2: This is ONLY an EXAMPLE on HOW-TO produce a customized "{Sextan} PINEv4 Sextans Backtest Framework" intput signal source, you can define your own indicator in the highlighted area in compliance with the uniform format, which guarantee when you use "Indicator on Indicator" function, it would not produce any error.
I use two simple moving average crossings to produce long and short entry signal with SMA3 and SMA8 in the example.
Background
Backtesting of technical indicators and strategies is the most common way to understand a quantitative strategy. However, the complicated configuration and adaptation work of backtesting many quantitative tools makes many traders who do not understand the code daunted. Moreover, although I have written a lot of strategies, I am still not very satisfied with the backtest configuration and writing efficiency. Therefore, I have been thinking about how to build a backtesting framework that can quickly and easily evaluate the backtesting performance of any indicator with a "long/short entry" indicator, that is, a "simple backtesting tool for dummies". The performance requirements should be stable, and the operation should be simple and convenient. It is best to "copy", "paste", and "a few mouse clicks" to complete the quick backtest and evaluation of a new indicator.
Luckily, I recently realized that TradingView provides an "Indicator on Indicator" feature, which is the perfect foundation for doing "hot swap" backtesting. My basic idea is to use a two-layer design. The first layer is the technical indicator signal source that needs to be embedded, which is only used to provide buy and sell signals of custom strategies; the second layer is the trading system, which is used to receive the output signals of the first layer, and filter the signals according to the agreed specifications. , Take Profit, Stop Loss, draw buy and sell signals and cost lines, define and send custom buy and sell alert messages to mobile phones, social software or trading interfaces. In general, this two-layer design is a flexible combination of "death and alive", which can meet the needs of most traders to quickly evaluate the performance of a certain technical indicator. The first layer here is flexible. Users can insert their own strategy codes according to my template, and they can draw buy and sell signals and output them to the second layer. The second layer is fixed, and the overall framework is solidified to ensure the stability and unity of the trading system. It is convenient to compare different or similar strategies under the same conditions. Finally, all trading signals are drawn on the chart, and the output strategy returns. test report.
The main function:
The first layer: "{Sextan} Your Indicator Source", the script provides a template for personalized strategy input, and the signal and definition interfaces ensure full compatibility with the second layer. Backtesting is performed stably in the backtesting framework of the layer. The first layer of this script is also relatively simple: enter your script in the highlighted custom script area, and after ensuring the final buy and sell signals long = bool condition, short = bool condition, the design of the first layer is considered complete. Input it into the PINE script editor of TradingView, save it and add it to the chart, you can see the pulse sequence in yellow (buy) and purple (sell) on the sub-picture, corresponding to the main picture, you can subjectively judge that the quality of the trading point of the strategy is good Bad.
The second layer: "{Sextan} PINEv4 Sextans Backtest Framework". This script is the standardized trading system strategy execution and alarm, used to generate the final report of the strategy backtest and some key indicators that I have customized that I find useful, such as: winning rate , Odds, Winning Surface, Kelly Ratio, Take Profit and Stop Loss Thresholds, Trading Frequency, etc. are evaluated according to the Kelly formula. To use the second layer, first load it into the TrainingView chart, no markers will appear on the chart, since you have not specified any strategy source signals, click on the gear-shaped setting next to the "{Sextan} PINEv4 Sextans BTFW" header button, you can open the backtest settings, the first item is to select your custom strategy source. Because we have added the strategy source to the chart in the previous step, you can easily find an option "{Sextan} Your Indicator Source: Signal" at the bottom of the list, this is the strategy source input we need, select and confirm , you can see various markers on the main graph, and quickly generate a backtesting profit graph and a list of backtesting reports. You can generate files and download the backtesting reports locally. You can also click the gear on the backtest chart interface to customize some conditions of the backtest, including: initial capital amount, currency type, percentage of each order placed, amount of pyramid additions, commission fees, slippage, etc. configuration. Note: The configuration in the interface dialog overrides the same configuration implemented by the code in the backtest script.
How to output charts:
The first layer: "{Sextan} Your Indicator Source", the output of this script is the pulse value of yellow and purple, yellow +1 means buy, purple -1 means sell.
The second layer: PINEv4 Sextans Backtest Framework". The output of this script is a bit complicated. After all, it is the entire trading system with a lot of information:
1. Blue and red arrows. The blue upward arrow indicates long position, the red downward arrow indicates short position, and the horizontal bar at the end of the purple arrow indicates take profit or stop loss exit.
2. Red and green lines. This is the holding cost line of the strategy, green represents the cost of holding a long position, and red represents the cost of holding a short position. The cost line is a continuous solid line and the price action is relatively close.
3. Green and yellow long take profit and stop loss area and green and yellow long take profit and stop loss fork. Once a long position is held, there is a conditional order for take profit and stop loss. The green horizontal line is the long take profit ratio line, and the yellow is the long stop loss ratio line; the green cross indicates the long take profit price, and the yellow cross indicates the long position. Stop loss price. It's worth noting that the prongs and wires don't necessarily go together. Because of the optimization of the algorithm, for a strong market, the take profit will occur after breaking the take profit line, and the profit will not be taken until the price falls.
4. The purple and red short take profit and stop loss area and the purple red short stop loss fork. Once a short position is held, there will be a take profit and stop loss conditional order, the red is the short take profit ratio line, and the purple is the short stop loss ratio line; the red cross indicates the short take profit price, and the purple cross indicates the short stop loss price.
5. In addition to the above signs, there are also text and numbers indicating the profit and loss values of long and short positions. "L" means long; "S" means short; "XL" means close long; "XS" means close short.
TradingView Strategy Tester Panel:
The overview graph is an intuitive graph that plots the blue (gain) and red (loss) curves of all backtest periods together, and notes: the absolute value and percentage of net profit, the number of all closed positions, the winning percentage, the profit factor, The maximum trading loss, the absolute value and ratio of the average trading profit and loss, and the average number of K-lines held in all trades.
Another is the performance summary. This is to display all long and short statistical indicators of backtesting in the form of a list, such as: net profit, gross profit, Sharpe ratio, maximum position, commission, times of profit and loss, etc.
Finally, the transaction list is a table indexed by the transaction serial number, showing the signal direction, date and time, price, profit and loss, accumulated profit and loss, maximum transaction profit, transaction loss and other values.
Remarks
Finally, I will explain that this is just the beginning of this model. I will continue to optimize the trading system of the second layer. Various optimization feedback and suggestions are welcome. For valuable feedback, I am willing to provide some L4/L5 technical indicators as rewards for free subscription rights.

[Sextan] B-Xtrender BacktestLevel: 1
NOTE: This is a request by @scantor516 to backtest B-Xtrender @PuppyTherapy by QuantTherapy with my Sextan framework. You can backtest many of my indicators in minutes now! Of course,you can define your own indicator in the highlighted area in compliance with the uniform format, which guarantee when you use "Indicator on Indicator" function, it would not produce any error.
Courtesy of QuantTherapy for his B-Xtrender @PuppyTherapy
Background
Backtesting of technical indicators and strategies is the most common way to understand a quantitative strategy. However, the complicated configuration and adaptation work of backtesting many quantitative tools makes many traders who do not understand the code daunted. Moreover, although I have written a lot of strategies, I am still not very satisfied with the backtest configuration and writing efficiency. Therefore, I have been thinking about how to build a backtesting framework that can quickly and easily evaluate the backtesting performance of any indicator with a "long/short entry" indicator, that is, a "simple backtesting tool for dummies". The performance requirements should be stable, and the operation should be simple and convenient. It is best to "copy", "paste", and "a few mouse clicks" to complete the quick backtest and evaluation of a new indicator.
Luckily, I recently realized that TradingView provides an "Indicator on Indicator" feature, which is the perfect foundation for doing "hot swap" backtesting. My basic idea is to use a two-layer design. The first layer is the technical indicator signal source that needs to be embedded, which is only used to provide buy and sell signals of custom strategies; the second layer is the trading system, which is used to receive the output signals of the first layer, and filter the signals according to the agreed specifications. , Take Profit, Stop Loss, draw buy and sell signals and cost lines, define and send custom buy and sell alert messages to mobile phones, social software or trading interfaces. In general, this two-layer design is a flexible combination of "death and alive", which can meet the needs of most traders to quickly evaluate the performance of a certain technical indicator. The first layer here is flexible. Users can insert their own strategy codes according to my template, and they can draw buy and sell signals and output them to the second layer. The second layer is fixed, and the overall framework is solidified to ensure the stability and unity of the trading system. It is convenient to compare different or similar strategies under the same conditions. Finally, all trading signals are drawn on the chart, and the output strategy returns. test report.
The main function:
The first layer: "{Sextan} Your Indicator Source", the script provides a template for personalized strategy input, and the signal and definition interfaces ensure full compatibility with the second layer. Backtesting is performed stably in the backtesting framework of the layer. The first layer of this script is also relatively simple: enter your script in the highlighted custom script area, and after ensuring the final buy and sell signals long = bool condition, short = bool condition, the design of the first layer is considered complete. Input it into the PINE script editor of TradingView, save it and add it to the chart, you can see the pulse sequence in yellow (buy) and purple (sell) on the sub-picture, corresponding to the main picture, you can subjectively judge that the quality of the trading point of the strategy is good Bad.
The second layer: "{Sextan} PINEv4 Sextans Backtest Framework". This script is the standardized trading system strategy execution and alarm, used to generate the final report of the strategy backtest and some key indicators that I have customized that I find useful, such as: winning rate , Odds, Winning Surface, Kelly Ratio, Take Profit and Stop Loss Thresholds, Trading Frequency, etc. are evaluated according to the Kelly formula. To use the second layer, first load it into the TrainingView chart, no markers will appear on the chart, since you have not specified any strategy source signals, click on the gear-shaped setting next to the "{Sextan} PINEv4 Sextans BTFW" header button, you can open the backtest settings, the first item is to select your custom strategy source. Because we have added the strategy source to the chart in the previous step, you can easily find an option "{Sextan} Your Indicator Source: Signal" at the bottom of the list, this is the strategy source input we need, select and confirm , you can see various markers on the main graph, and quickly generate a backtesting profit graph and a list of backtesting reports. You can generate files and download the backtesting reports locally. You can also click the gear on the backtest chart interface to customize some conditions of the backtest, including: initial capital amount, currency type, percentage of each order placed, amount of pyramid additions, commission fees, slippage, etc. configuration. Note: The configuration in the interface dialog overrides the same configuration implemented by the code in the backtest script.
How to output charts:
The first layer: "{Sextan} Your Indicator Source", the output of this script is the pulse value of yellow and purple, yellow +1 means buy, purple -1 means sell.
The second layer: PINEv4 Sextans Backtest Framework". The output of this script is a bit complicated. After all, it is the entire trading system with a lot of information:
1. Blue and red arrows. The blue upward arrow indicates long position, the red downward arrow indicates short position, and the horizontal bar at the end of the purple arrow indicates take profit or stop loss exit.
2. Red and green lines. This is the holding cost line of the strategy, green represents the cost of holding a long position, and red represents the cost of holding a short position. The cost line is a continuous solid line and the price action is relatively close.
3. Green and yellow long take profit and stop loss area and green and yellow long take profit and stop loss fork. Once a long position is held, there is a conditional order for take profit and stop loss. The green horizontal line is the long take profit ratio line, and the yellow is the long stop loss ratio line; the green cross indicates the long take profit price, and the yellow cross indicates the long position. Stop loss price. It's worth noting that the prongs and wires don't necessarily go together. Because of the optimization of the algorithm, for a strong market, the take profit will occur after breaking the take profit line, and the profit will not be taken until the price falls.
4. The purple and red short take profit and stop loss area and the purple red short stop loss fork. Once a short position is held, there will be a take profit and stop loss conditional order, the red is the short take profit ratio line, and the purple is the short stop loss ratio line; the red cross indicates the short take profit price, and the purple cross indicates the short stop loss price.
5. In addition to the above signs, there are also text and numbers indicating the profit and loss values of long and short positions. "L" means long; "S" means short; "XL" means close long; "XS" means close short.
TradingView Strategy Tester Panel:
The overview graph is an intuitive graph that plots the blue (gain) and red (loss) curves of all backtest periods together, and notes: the absolute value and percentage of net profit, the number of all closed positions, the winning percentage, the profit factor, The maximum trading loss, the absolute value and ratio of the average trading profit and loss, and the average number of K-lines held in all trades.
Another is the performance summary. This is to display all long and short statistical indicators of backtesting in the form of a list, such as: net profit, gross profit, Sharpe ratio, maximum position, commission, times of profit and loss, etc.
Finally, the transaction list is a table indexed by the transaction serial number, showing the signal direction, date and time, price, profit and loss, accumulated profit and loss, maximum transaction profit, transaction loss and other values.
Remarks
Finally, I will explain that this is just the beginning of this model. I will continue to optimize the trading system of the second layer. Various optimization feedback and suggestions are welcome. For valuable feedback, I am willing to provide some L4/L5 technical indicators as rewards for free subscription rights.

[Sextan] Haos Vieual BacktestLevel: 1
NOTE: This is a request by @scantor516 to backtest Haos Visual @PuppyTherapy by QuantTherapy with my Sextan framework. You can backtest many of my indicators in minutes now! Of course,you can define your own indicator in the highlighted area in compliance with the uniform format, which guarantee when you use "Indicator on Indicator" function, it would not produce any error.
Courtesy of QuantTherapy for his Haos Visual @PuppyTherapy
Background
Backtesting of technical indicators and strategies is the most common way to understand a quantitative strategy. However, the complicated configuration and adaptation work of backtesting many quantitative tools makes many traders who do not understand the code daunted. Moreover, although I have written a lot of strategies, I am still not very satisfied with the backtest configuration and writing efficiency. Therefore, I have been thinking about how to build a backtesting framework that can quickly and easily evaluate the backtesting performance of any indicator with a "long/short entry" indicator, that is, a "simple backtesting tool for dummies". The performance requirements should be stable, and the operation should be simple and convenient. It is best to "copy", "paste", and "a few mouse clicks" to complete the quick backtest and evaluation of a new indicator.
Luckily, I recently realized that TradingView provides an "Indicator on Indicator" feature, which is the perfect foundation for doing "hot swap" backtesting. My basic idea is to use a two-layer design. The first layer is the technical indicator signal source that needs to be embedded, which is only used to provide buy and sell signals of custom strategies; the second layer is the trading system, which is used to receive the output signals of the first layer, and filter the signals according to the agreed specifications. , Take Profit, Stop Loss, draw buy and sell signals and cost lines, define and send custom buy and sell alert messages to mobile phones, social software or trading interfaces. In general, this two-layer design is a flexible combination of "death and alive", which can meet the needs of most traders to quickly evaluate the performance of a certain technical indicator. The first layer here is flexible. Users can insert their own strategy codes according to my template, and they can draw buy and sell signals and output them to the second layer. The second layer is fixed, and the overall framework is solidified to ensure the stability and unity of the trading system. It is convenient to compare different or similar strategies under the same conditions. Finally, all trading signals are drawn on the chart, and the output strategy returns. test report.
The main function:
The first layer: "{Sextan} Your Indicator Source", the script provides a template for personalized strategy input, and the signal and definition interfaces ensure full compatibility with the second layer. Backtesting is performed stably in the backtesting framework of the layer. The first layer of this script is also relatively simple: enter your script in the highlighted custom script area, and after ensuring the final buy and sell signals long = bool condition, short = bool condition, the design of the first layer is considered complete. Input it into the PINE script editor of TradingView, save it and add it to the chart, you can see the pulse sequence in yellow (buy) and purple (sell) on the sub-picture, corresponding to the main picture, you can subjectively judge that the quality of the trading point of the strategy is good Bad.
The second layer: "{Sextan} PINEv4 Sextans Backtest Framework". This script is the standardized trading system strategy execution and alarm, used to generate the final report of the strategy backtest and some key indicators that I have customized that I find useful, such as: winning rate , Odds, Winning Surface, Kelly Ratio, Take Profit and Stop Loss Thresholds, Trading Frequency, etc. are evaluated according to the Kelly formula. To use the second layer, first load it into the TrainingView chart, no markers will appear on the chart, since you have not specified any strategy source signals, click on the gear-shaped setting next to the "{Sextan} PINEv4 Sextans BTFW" header button, you can open the backtest settings, the first item is to select your custom strategy source. Because we have added the strategy source to the chart in the previous step, you can easily find an option "{Sextan} Your Indicator Source: Signal" at the bottom of the list, this is the strategy source input we need, select and confirm , you can see various markers on the main graph, and quickly generate a backtesting profit graph and a list of backtesting reports. You can generate files and download the backtesting reports locally. You can also click the gear on the backtest chart interface to customize some conditions of the backtest, including: initial capital amount, currency type, percentage of each order placed, amount of pyramid additions, commission fees, slippage, etc. configuration. Note: The configuration in the interface dialog overrides the same configuration implemented by the code in the backtest script.
How to output charts:
The first layer: "{Sextan} Your Indicator Source", the output of this script is the pulse value of yellow and purple, yellow +1 means buy, purple -1 means sell.
The second layer: PINEv4 Sextans Backtest Framework". The output of this script is a bit complicated. After all, it is the entire trading system with a lot of information:
1. Blue and red arrows. The blue upward arrow indicates long position, the red downward arrow indicates short position, and the horizontal bar at the end of the purple arrow indicates take profit or stop loss exit.
2. Red and green lines. This is the holding cost line of the strategy, green represents the cost of holding a long position, and red represents the cost of holding a short position. The cost line is a continuous solid line and the price action is relatively close.
3. Green and yellow long take profit and stop loss area and green and yellow long take profit and stop loss fork. Once a long position is held, there is a conditional order for take profit and stop loss. The green horizontal line is the long take profit ratio line, and the yellow is the long stop loss ratio line; the green cross indicates the long take profit price, and the yellow cross indicates the long position. Stop loss price. It's worth noting that the prongs and wires don't necessarily go together. Because of the optimization of the algorithm, for a strong market, the take profit will occur after breaking the take profit line, and the profit will not be taken until the price falls.
4. The purple and red short take profit and stop loss area and the purple red short stop loss fork. Once a short position is held, there will be a take profit and stop loss conditional order, the red is the short take profit ratio line, and the purple is the short stop loss ratio line; the red cross indicates the short take profit price, and the purple cross indicates the short stop loss price.
5. In addition to the above signs, there are also text and numbers indicating the profit and loss values of long and short positions. "L" means long; "S" means short; "XL" means close long; "XS" means close short.
TradingView Strategy Tester Panel:
The overview graph is an intuitive graph that plots the blue (gain) and red (loss) curves of all backtest periods together, and notes: the absolute value and percentage of net profit, the number of all closed positions, the winning percentage, the profit factor, The maximum trading loss, the absolute value and ratio of the average trading profit and loss, and the average number of K-lines held in all trades.
Another is the performance summary. This is to display all long and short statistical indicators of backtesting in the form of a list, such as: net profit, gross profit, Sharpe ratio, maximum position, commission, times of profit and loss, etc.
Finally, the transaction list is a table indexed by the transaction serial number, showing the signal direction, date and time, price, profit and loss, accumulated profit and loss, maximum transaction profit, transaction loss and other values.
Remarks
Finally, I will explain that this is just the beginning of this model. I will continue to optimize the trading system of the second layer. Various optimization feedback and suggestions are welcome. For valuable feedback, I am willing to provide some L4/L5 technical indicators as rewards for free subscription rights.

[Sextan] Delta-RSI Oscillator BacktestLevel: 1
NOTE: This is a request by @scantor516 to backtest Delta-RSI Oscillator by tbiktag with my Sextan framework. You can backtest many of my indicators in minutes now! Of course,you can define your own indicator in the highlighted area in compliance with the uniform format, which guarantee when you use "Indicator on Indicator" function, it would not produce any error.
Courtesy of tbiktag for his Delta-RSI Oscillator Strategy
Background
Backtesting of technical indicators and strategies is the most common way to understand a quantitative strategy. However, the complicated configuration and adaptation work of backtesting many quantitative tools makes many traders who do not understand the code daunted. Moreover, although I have written a lot of strategies, I am still not very satisfied with the backtest configuration and writing efficiency. Therefore, I have been thinking about how to build a backtesting framework that can quickly and easily evaluate the backtesting performance of any indicator with a "long/short entry" indicator, that is, a "simple backtesting tool for dummies". The performance requirements should be stable, and the operation should be simple and convenient. It is best to "copy", "paste", and "a few mouse clicks" to complete the quick backtest and evaluation of a new indicator.
Luckily, I recently realized that TradingView provides an "Indicator on Indicator" feature, which is the perfect foundation for doing "hot swap" backtesting. My basic idea is to use a two-layer design. The first layer is the technical indicator signal source that needs to be embedded, which is only used to provide buy and sell signals of custom strategies; the second layer is the trading system, which is used to receive the output signals of the first layer, and filter the signals according to the agreed specifications. , Take Profit, Stop Loss, draw buy and sell signals and cost lines, define and send custom buy and sell alert messages to mobile phones, social software or trading interfaces. In general, this two-layer design is a flexible combination of "death and alive", which can meet the needs of most traders to quickly evaluate the performance of a certain technical indicator. The first layer here is flexible. Users can insert their own strategy codes according to my template, and they can draw buy and sell signals and output them to the second layer. The second layer is fixed, and the overall framework is solidified to ensure the stability and unity of the trading system. It is convenient to compare different or similar strategies under the same conditions. Finally, all trading signals are drawn on the chart, and the output strategy returns. test report.
The main function:
The first layer: "{Sextan} Your Indicator Source", the script provides a template for personalized strategy input, and the signal and definition interfaces ensure full compatibility with the second layer. Backtesting is performed stably in the backtesting framework of the layer. The first layer of this script is also relatively simple: enter your script in the highlighted custom script area, and after ensuring the final buy and sell signals long = bool condition, short = bool condition, the design of the first layer is considered complete. Input it into the PINE script editor of TradingView, save it and add it to the chart, you can see the pulse sequence in yellow (buy) and purple (sell) on the sub-picture, corresponding to the main picture, you can subjectively judge that the quality of the trading point of the strategy is good Bad.
The second layer: "{Sextan} PINEv4 Sextans Backtest Framework". This script is the standardized trading system strategy execution and alarm, used to generate the final report of the strategy backtest and some key indicators that I have customized that I find useful, such as: winning rate , Odds, Winning Surface, Kelly Ratio, Take Profit and Stop Loss Thresholds, Trading Frequency, etc. are evaluated according to the Kelly formula. To use the second layer, first load it into the TrainingView chart, no markers will appear on the chart, since you have not specified any strategy source signals, click on the gear-shaped setting next to the "{Sextan} PINEv4 Sextans BTFW" header button, you can open the backtest settings, the first item is to select your custom strategy source. Because we have added the strategy source to the chart in the previous step, you can easily find an option "{Sextan} Your Indicator Source: Signal" at the bottom of the list, this is the strategy source input we need, select and confirm , you can see various markers on the main graph, and quickly generate a backtesting profit graph and a list of backtesting reports. You can generate files and download the backtesting reports locally. You can also click the gear on the backtest chart interface to customize some conditions of the backtest, including: initial capital amount, currency type, percentage of each order placed, amount of pyramid additions, commission fees, slippage, etc. configuration. Note: The configuration in the interface dialog overrides the same configuration implemented by the code in the backtest script.
How to output charts:
The first layer: "{Sextan} Your Indicator Source", the output of this script is the pulse value of yellow and purple, yellow +1 means buy, purple -1 means sell.
The second layer: PINEv4 Sextans Backtest Framework". The output of this script is a bit complicated. After all, it is the entire trading system with a lot of information:
1. Blue and red arrows. The blue upward arrow indicates long position, the red downward arrow indicates short position, and the horizontal bar at the end of the purple arrow indicates take profit or stop loss exit.
2. Red and green lines. This is the holding cost line of the strategy, green represents the cost of holding a long position, and red represents the cost of holding a short position. The cost line is a continuous solid line and the price action is relatively close.
3. Green and yellow long take profit and stop loss area and green and yellow long take profit and stop loss fork. Once a long position is held, there is a conditional order for take profit and stop loss. The green horizontal line is the long take profit ratio line, and the yellow is the long stop loss ratio line; the green cross indicates the long take profit price, and the yellow cross indicates the long position. Stop loss price. It's worth noting that the prongs and wires don't necessarily go together. Because of the optimization of the algorithm, for a strong market, the take profit will occur after breaking the take profit line, and the profit will not be taken until the price falls.
4. The purple and red short take profit and stop loss area and the purple red short stop loss fork. Once a short position is held, there will be a take profit and stop loss conditional order, the red is the short take profit ratio line, and the purple is the short stop loss ratio line; the red cross indicates the short take profit price, and the purple cross indicates the short stop loss price.
5. In addition to the above signs, there are also text and numbers indicating the profit and loss values of long and short positions. "L" means long; "S" means short; "XL" means close long; "XS" means close short.
TradingView Strategy Tester Panel:
The overview graph is an intuitive graph that plots the blue (gain) and red (loss) curves of all backtest periods together, and notes: the absolute value and percentage of net profit, the number of all closed positions, the winning percentage, the profit factor, The maximum trading loss, the absolute value and ratio of the average trading profit and loss, and the average number of K-lines held in all trades.
Another is the performance summary. This is to display all long and short statistical indicators of backtesting in the form of a list, such as: net profit, gross profit, Sharpe ratio, maximum position, commission, times of profit and loss, etc.
Finally, the transaction list is a table indexed by the transaction serial number, showing the signal direction, date and time, price, profit and loss, accumulated profit and loss, maximum transaction profit, transaction loss and other values.
Remarks
Finally, I will explain that this is just the beginning of this model. I will continue to optimize the trading system of the second layer. Various optimization feedback and suggestions are welcome. For valuable feedback, I am willing to provide some L4/L5 technical indicators as rewards for free subscription rights.
